
Ask what the driest place on Earth is and the honest answer depends on what exactly you're measuring. Two very different environments both have a genuine claim, and comparing them says a lot about how differently "dry" can happen.
The Atacama Desert: the driest non-polar desert on Earth
Stretching for more than 600 miles along the Pacific coast of northern Chile, wedged between the Andes and the ocean, the Atacama's hyper-arid core receives on average somewhere between about 1mm and 15mm of rain a year, depending on exactly which part of the desert is being measured. Some individual weather stations have recorded essentially nothing at all across decades of observation. One station reportedly measured just 0.5mm of rain per year averaged across the period from 1964 to 2001, a rate so low it would take well over a century to fill an ordinary coffee mug.
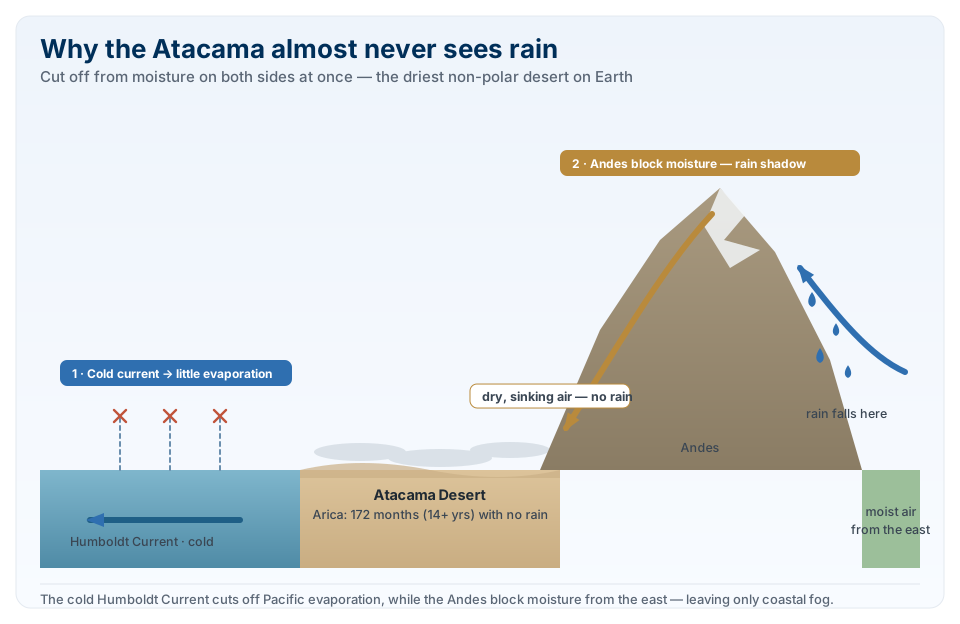
The most extreme official record belongs to the coastal town of Arica, which the World Meteorological Organization recognises as having gone through the longest sustained dry period ever documented anywhere on Earth: 172 months, more than 14 years, from October 1903 to January 1918, without a single drop of rain. Arica's average annual rainfall today is still only around 0.8mm, roughly 75 times less than Death Valley receives in an average year, and low enough that it's regularly cited as having the lowest average precipitation of any city on the planet.
Why it's so dry
Three things combine to starve the Atacama of rain. The Humboldt Current runs cold water up the Chilean coast from the sub-Antarctic, which sharply limits how much moisture evaporates off the nearby ocean surface in the first place. What moisture does form is then blocked by the Andes to the east, which force any remaining moist air upward and wring most of it out well before it can reach the desert floor, a textbook rain-shadow effect. Between the cold current suppressing evaporation and the mountains blocking what little does form, the Atacama ends up cut off from both of its most obvious potential water sources at once. What moisture does reach the ground mostly arrives as coastal fog rather than rain, enough to support a surprising amount of specialised desert life near towns like San Pedro de Atacama, but far short of anything that would register as measurable rainfall.
The Antarctic rival: the McMurdo Dry Valleys
If the question is which environment overall is driest, rather than which desert specifically, the answer shifts to Antarctica. The McMurdo Dry Valleys, a cluster of largely ice-free valleys near McMurdo Sound, receive next to no precipitation at all, not because of a rain shadow but because of fierce, dry katabatic winds that pour down off the polar plateau, warming slightly as they descend and evaporating away any snow or ice before it has a chance to settle. Some scientists estimate parts of these valleys have gone without any liquid rain for around two million years, though long-term research has still documented at least one rare rain event there, in Taylor Valley in December 2018, a reminder that even the driest places on Earth are defined by extreme rarity rather than a literal, unbroken never.
Which one is "the" driest place genuinely depends on the measure. Ask for the driest non-polar desert, the place most associated with rainfall records, and the answer is the Atacama. Ask for the driest environment on Earth by any measure, and most scientists point to the Dry Valleys instead. Both are real answers to a question that, it turns out, doesn't have just one.