
The Capracotta snowstorm: how an Italian village set a world snowfall record
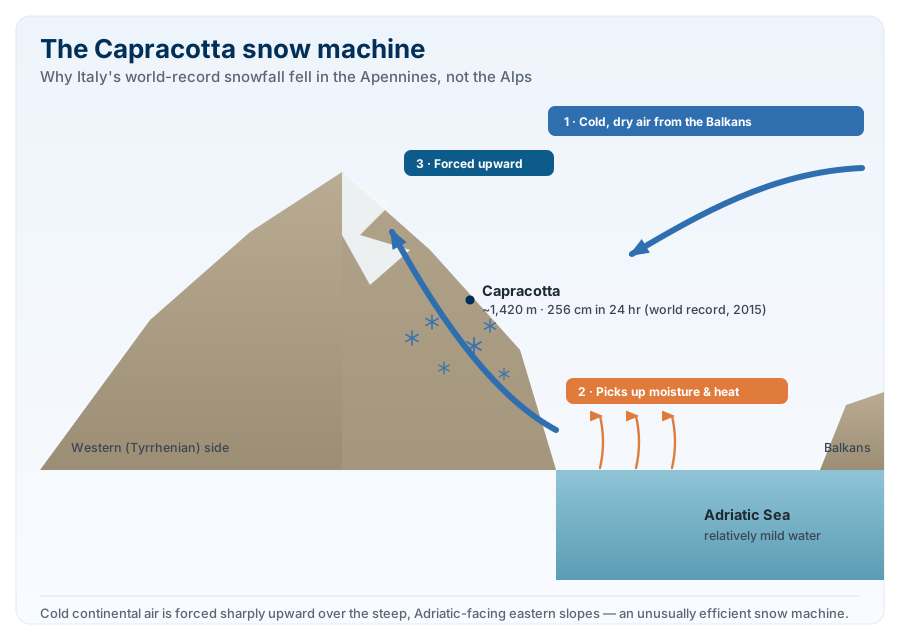
Ask most people where they'd expect the biggest snowstorm ever recorded to have happened, and the Alps would be a reasonable guess. The actual record belongs to a village of about 1,000 people in the central Apennines, roughly halfway down the Italian peninsula and closer to the Adriatic Sea than to any glacier.
What happened
On 5 March 2015, the village of Capracotta, in Italy's Molise region, received 256cm of snow, roughly 8 feet 4 inches, in about 18 hours. Photos from the event show residents shaking hands with neighbours from second-storey windows, level with the top of the snow in the street below. Winds during the storm gusted over 160 km/h, whipping the snow into drifts and making accurate measurement genuinely difficult, one of the reasons extreme snowfall totals like this are notoriously hard to verify.
Capracotta wasn't alone. Pescocostanzo, a town about 34km away, recorded 240cm over the same period, an almost equally extraordinary total from the same storm system.
Is it actually the record?
Snowfall records are messier to confirm than temperature or rainfall records, because measurement technique matters enormously: snow compacts, drifts, and can be blown away or added to by wind between readings, and the standard method requires clearing a measuring board every six hours to avoid double-counting settled snow. Despite that difficulty, Guinness World Records has recognised Capracotta's 256cm as the new world record for snowfall in a 24-hour period, surpassing the previous long-standing record of 192cm to 193cm, set at Silver Lake, Colorado, USA, on 21 April 1921, a record that had stood for nearly a century.
Why this stretch of Italy, and not the Alps
It seems counterintuitive that a record snowfall happened somewhere other than the Alps, but the mechanism behind Capracotta's storm is genuinely different from what drives Alpine snow, and it's specific to this part of Italy.
The Apennines run down the spine of the Italian peninsula, and their eastern, Adriatic-facing slopes sit in a very particular position: close enough to the Balkans and eastern Europe to regularly receive genuinely cold continental air, but also right against the relatively mild waters of the Adriatic Sea. When a cold outbreak from the Balkans crosses that stretch of sea, it picks up moisture and a small amount of heat from the water on the way across, then slams directly into the Apennines and is forced abruptly upward. That combination, cold continental air, extra moisture from a warm sea crossing, and sudden orographic lift into steep terrain, is an unusually efficient snow-making machine, and a peer-reviewed climatology study of the region specifically identifies this mechanism as the reason the eastern slopes of the central Apennines receive considerably more snow than the western, Tyrrhenian side of the same mountain range.
It also explains why the region is capable of both extremes: mild, nearly snowless winters when Atlantic or Mediterranean air dominates, and sudden, enormous dumps when a cold Balkan outbreak lines up with a slow-moving low pressure system and enough moisture. Capracotta's storm had exactly that alignment, a low that lingered rather than moved through, giving the mechanism time to keep working for the better part of a day.
Other events in the same stretch of mountains
Capracotta's storm wasn't a total anomaly for the region, even if it was the most extreme confirmed example. Italian meteorological writing from as far back as December 1961 describes a claim of 365cm falling in 24 hours at Roccacaramanico, a village at just 878 metres elevation in the same general area, a figure that would exceed even Capracotta's total if it could be verified, but it predates the kind of rigorous measurement standards that allowed Capracotta's total to be officially ratified.
More recently, the same eastern Apennines have continued to produce similarly outsized events relative to their surroundings: storms crossing the Adriatic side of the range have repeatedly buried resorts in this part of central Italy while the western side of the country stayed comparatively dry, a pattern consistent with the same cold-air- over-warm-sea mechanism that produced the 2015 record.